
When 'Commercial' Hides the Story: Modeling Electricity Use During COVID-19
The so what: why should we care?
Utility planners often group customers into broad categories: residential, commercial, and industrial. That is useful for reporting, but it can be dangerously incomplete when conditions change quickly.
During the COVID-19 pandemic, commercial buildings did not behave as one unified sector. Hotels, restaurants, schools, medical offices, religious buildings, performance venues, and offices faced different restrictions, operating constraints, and customer behavior. Their electricity-use patterns reflected those differences.
That matters beyond the pandemic. Utilities are being asked to forecast demand during disruptions, design effective demand-response programs, manage financial risk, and support community resilience. If a broad customer category hides meaningful differences in how buildings actually operate, decisions based on that category can miss the real story.
In this peer-reviewed research project, which I co-authored, we combined smart-meter data, building-use classifications, outdoor temperature, and the timing of COVID-related public health orders to estimate how electricity consumption changed across commercial property types in Fort Collins, Colorado.
The central lesson was straightforward: the label “commercial” concealed important variation in electricity use, operational flexibility, and recovery.
The analytics question
The study began with a counterfactual question:
How much electricity would Fort Collins buildings have used in 2020 if the COVID-19 disruption had not occurred?
A simple comparison of 2019 and 2020 totals would not be enough. Electricity consumption changes with temperature, season, and day type. A hotter summer, for example, could increase cooling demand even while a building was being used less.
The analytical task was therefore to build a weather-normalized baseline for expected electricity use, compare delivered 2020 consumption against that baseline, and then examine whether deviations varied across building types and in relation to major policy changes.
Data: combining operational, physical, and policy context
The project used two years of 15-minute interval electricity data from Fort Collins Utilities, covering approximately 77,000 premises. The interval data were aggregated into daily consumption values for modeling.
The analysis brought together four main data sources:
| Data source | Role in the analysis |
|---|---|
| Smart-meter electricity data, 2019-2020 | Measured baseline-period and pandemic-period consumption |
| Larimer County property classifications | Distinguished building functions such as lodging, food service, offices, schools, public assembly, and outpatient healthcare |
| Daily outdoor temperature | Controlled for weather-driven variation in electricity use |
| COVID-related public health and executive orders | Provided temporal context for interpreting demand changes |
This integration was the key analytical move. Standard utility rate codes could show that commercial demand fell. Building-use classifications made it possible to ask which kinds of commercial buildings changed, when, and by how much.
Data quality and inclusion decisions
The study preserved comparability by excluding locations that changed rate class or property type, newly constructed buildings, strip malls with mixed tenant uses, and certain process-driven categories that did not fit the thermal modeling approach. For the education analysis, the sample was limited to Poudre School District K-12 buildings so that the properties followed a common operating schedule.
Because customer-level utility data are protected, the underlying dataset is not public. The visualizations in this portfolio post are recreated from aggregate results published in the article rather than from account-level records.
Analytics workflow: from metered use to expected use
1. Prepare a stable analytical sample
To measure change credibly, we needed a sample in which the building function and utility classification stayed stable between the baseline year and the pandemic year. This reduced the risk that changes in consumption were caused by new construction, a change in tenant use, or a change in rate category rather than pandemic-related operations.
2. Engineer features that reflect electricity demand
The 15-minute smart-meter readings were aggregated into daily loads. The model incorporated variables that influence expected daily electricity use:
- outdoor temperature;
- weekday versus weekend operation;
- for K-12 schools, whether the district was in session or in recess.
In Fort Collins, most space heating is provided by natural gas, while cooling is primarily electric. For that reason, electricity responds differently to cold and warm days. The model used separate temperature relationships below and above 55 degrees Fahrenheit, allowing warmer-weather cooling demand to be modeled distinctly.
3. Model expected 2020 electricity use
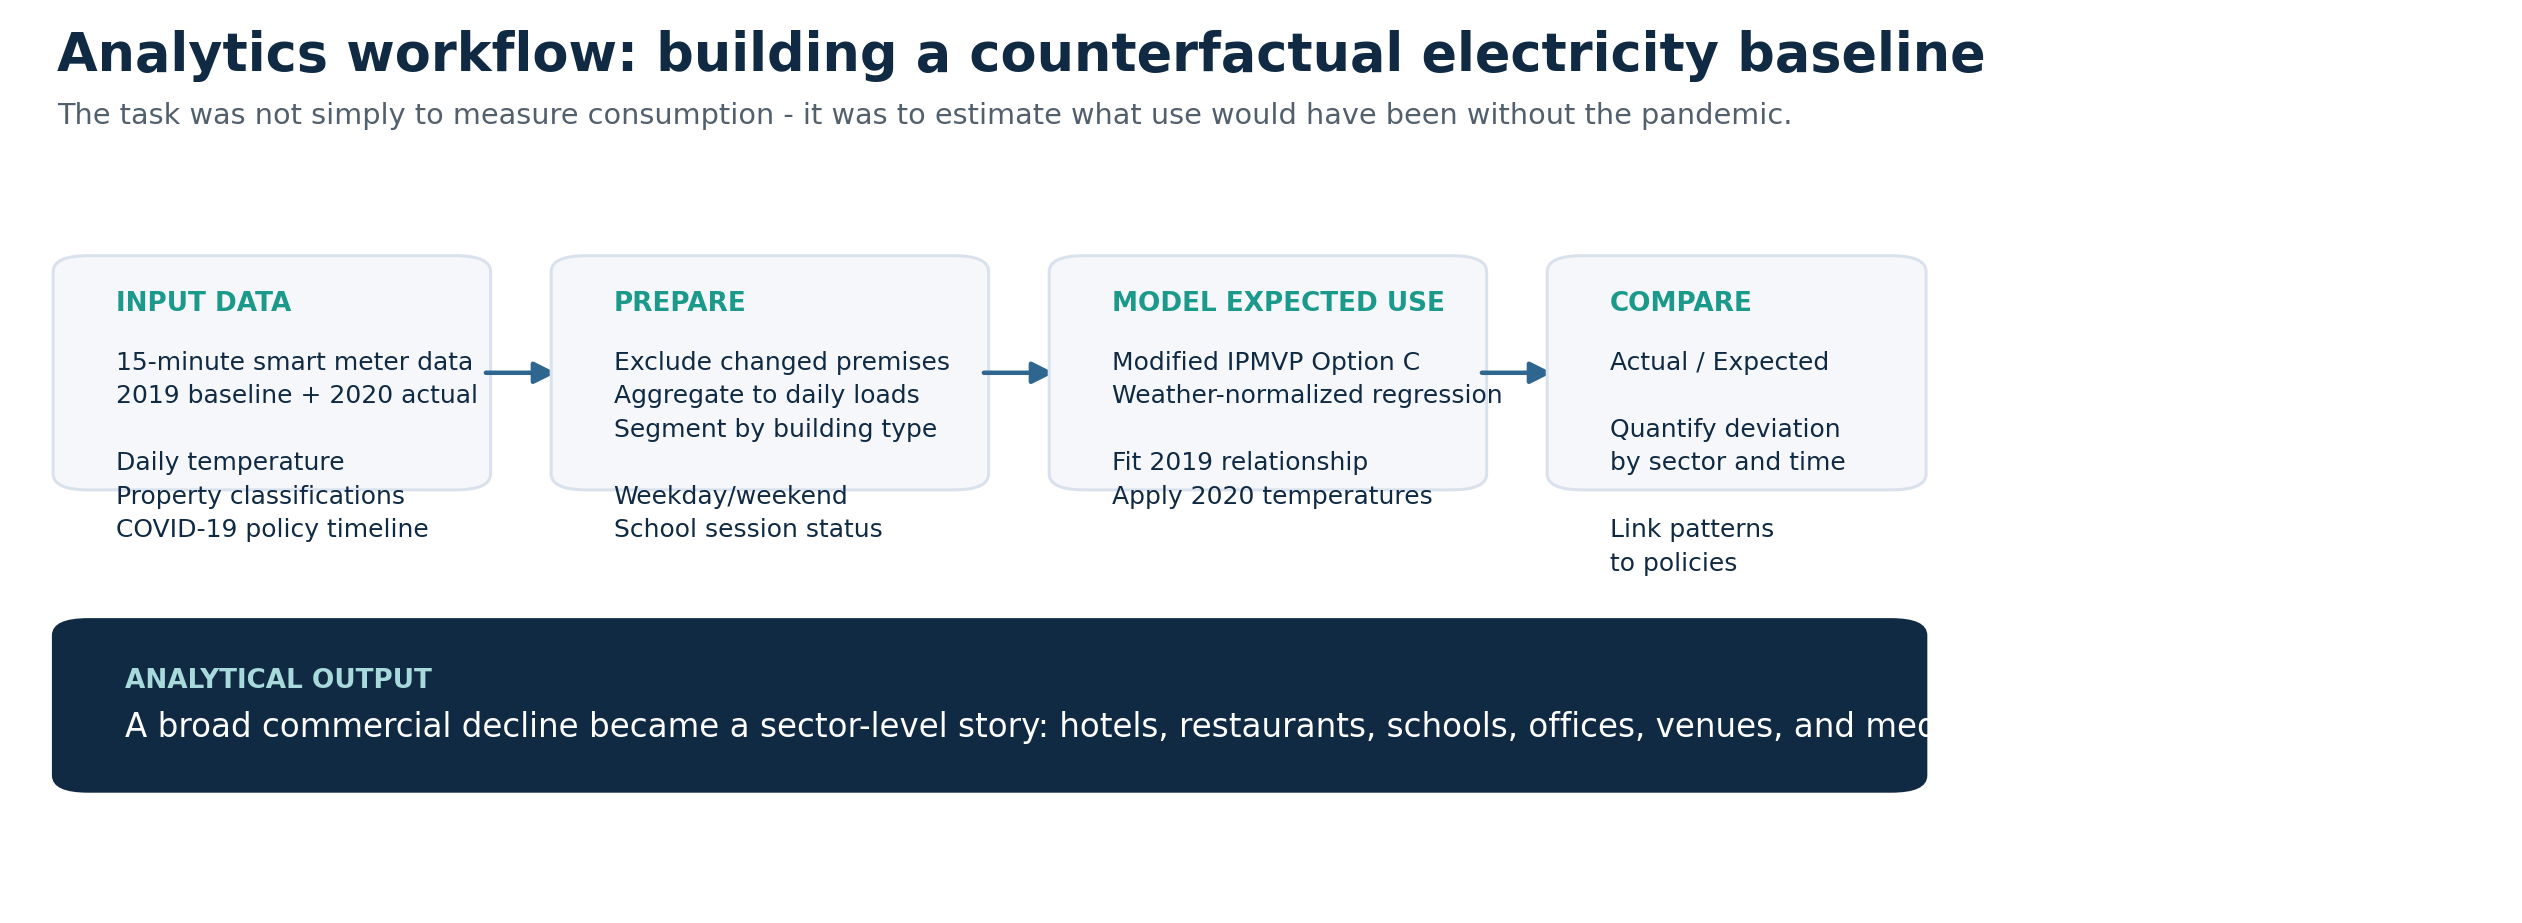
The study adapted the International Performance Measurement and Verification Protocol (IPMVP) Option C approach, commonly used to estimate whole-building energy savings after efficiency improvements.
Instead of a retrofit, the “intervention” was the abrupt shift in building occupancy and operation caused by the pandemic. The analytical logic was:
- Fit weather-normalized electricity-use relationships using 2019 data.
- Insert the actual daily temperatures observed in 2020.
- Estimate expected 2020 electricity consumption in the absence of pandemic-related change.
- Compare actual 2020 use with modeled expected use.
The original analysis was performed in ROOT. For this portfolio post, I recreated selected graphics using the published aggregate results to make the findings accessible in a project-story format.
4. Validate the baseline before interpreting disruption
The pandemic did not substantially affect Fort Collins until March 2020. That made January and February useful for checking model performance: actual consumption during those months remained close to modeled expected consumption across classes. Once restrictions and behavior changes began in March, commercial-sector demand moved visibly below expectation.
Findings: the commercial sector was not one story
At the aggregate level, the results aligned with the broad narrative seen elsewhere in 2020: commercial electricity use fell while residential electricity use changed far less dramatically. The total reduction in electricity consumption for the utility system was 2.5%, a meaningful financial impact for a municipal utility.
But the value of this project was in moving beyond the aggregate result.
Finding 1: annual declines varied substantially by building function
Observed annual electricity consumption fell sharply for buildings centered on gatherings, occupancy, and travel. Public assembly buildings, K-12 schools, and lodging properties saw some of the largest reductions, while outpatient healthcare showed a much smaller annual decline.
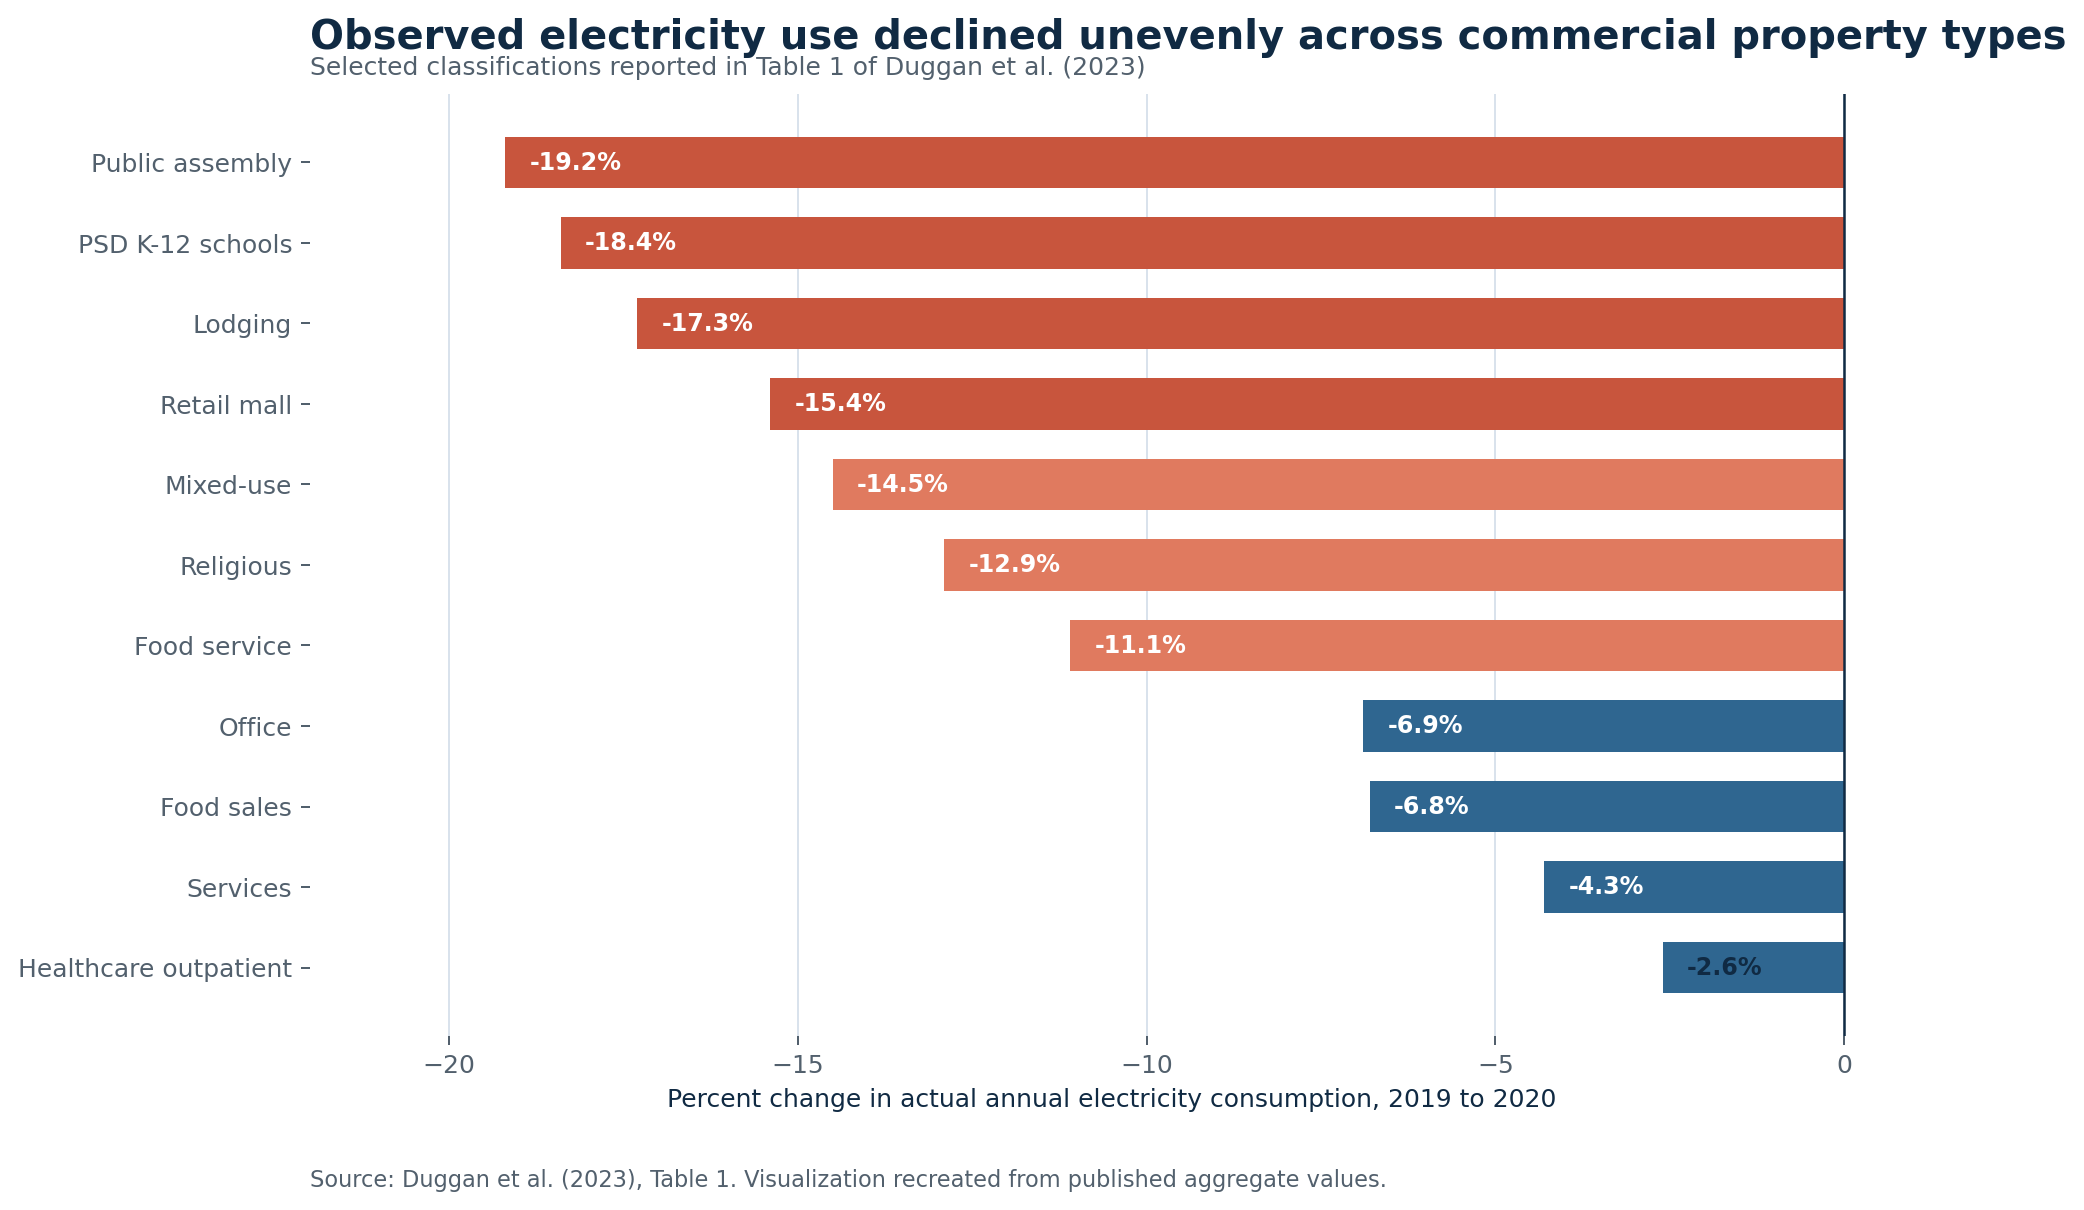
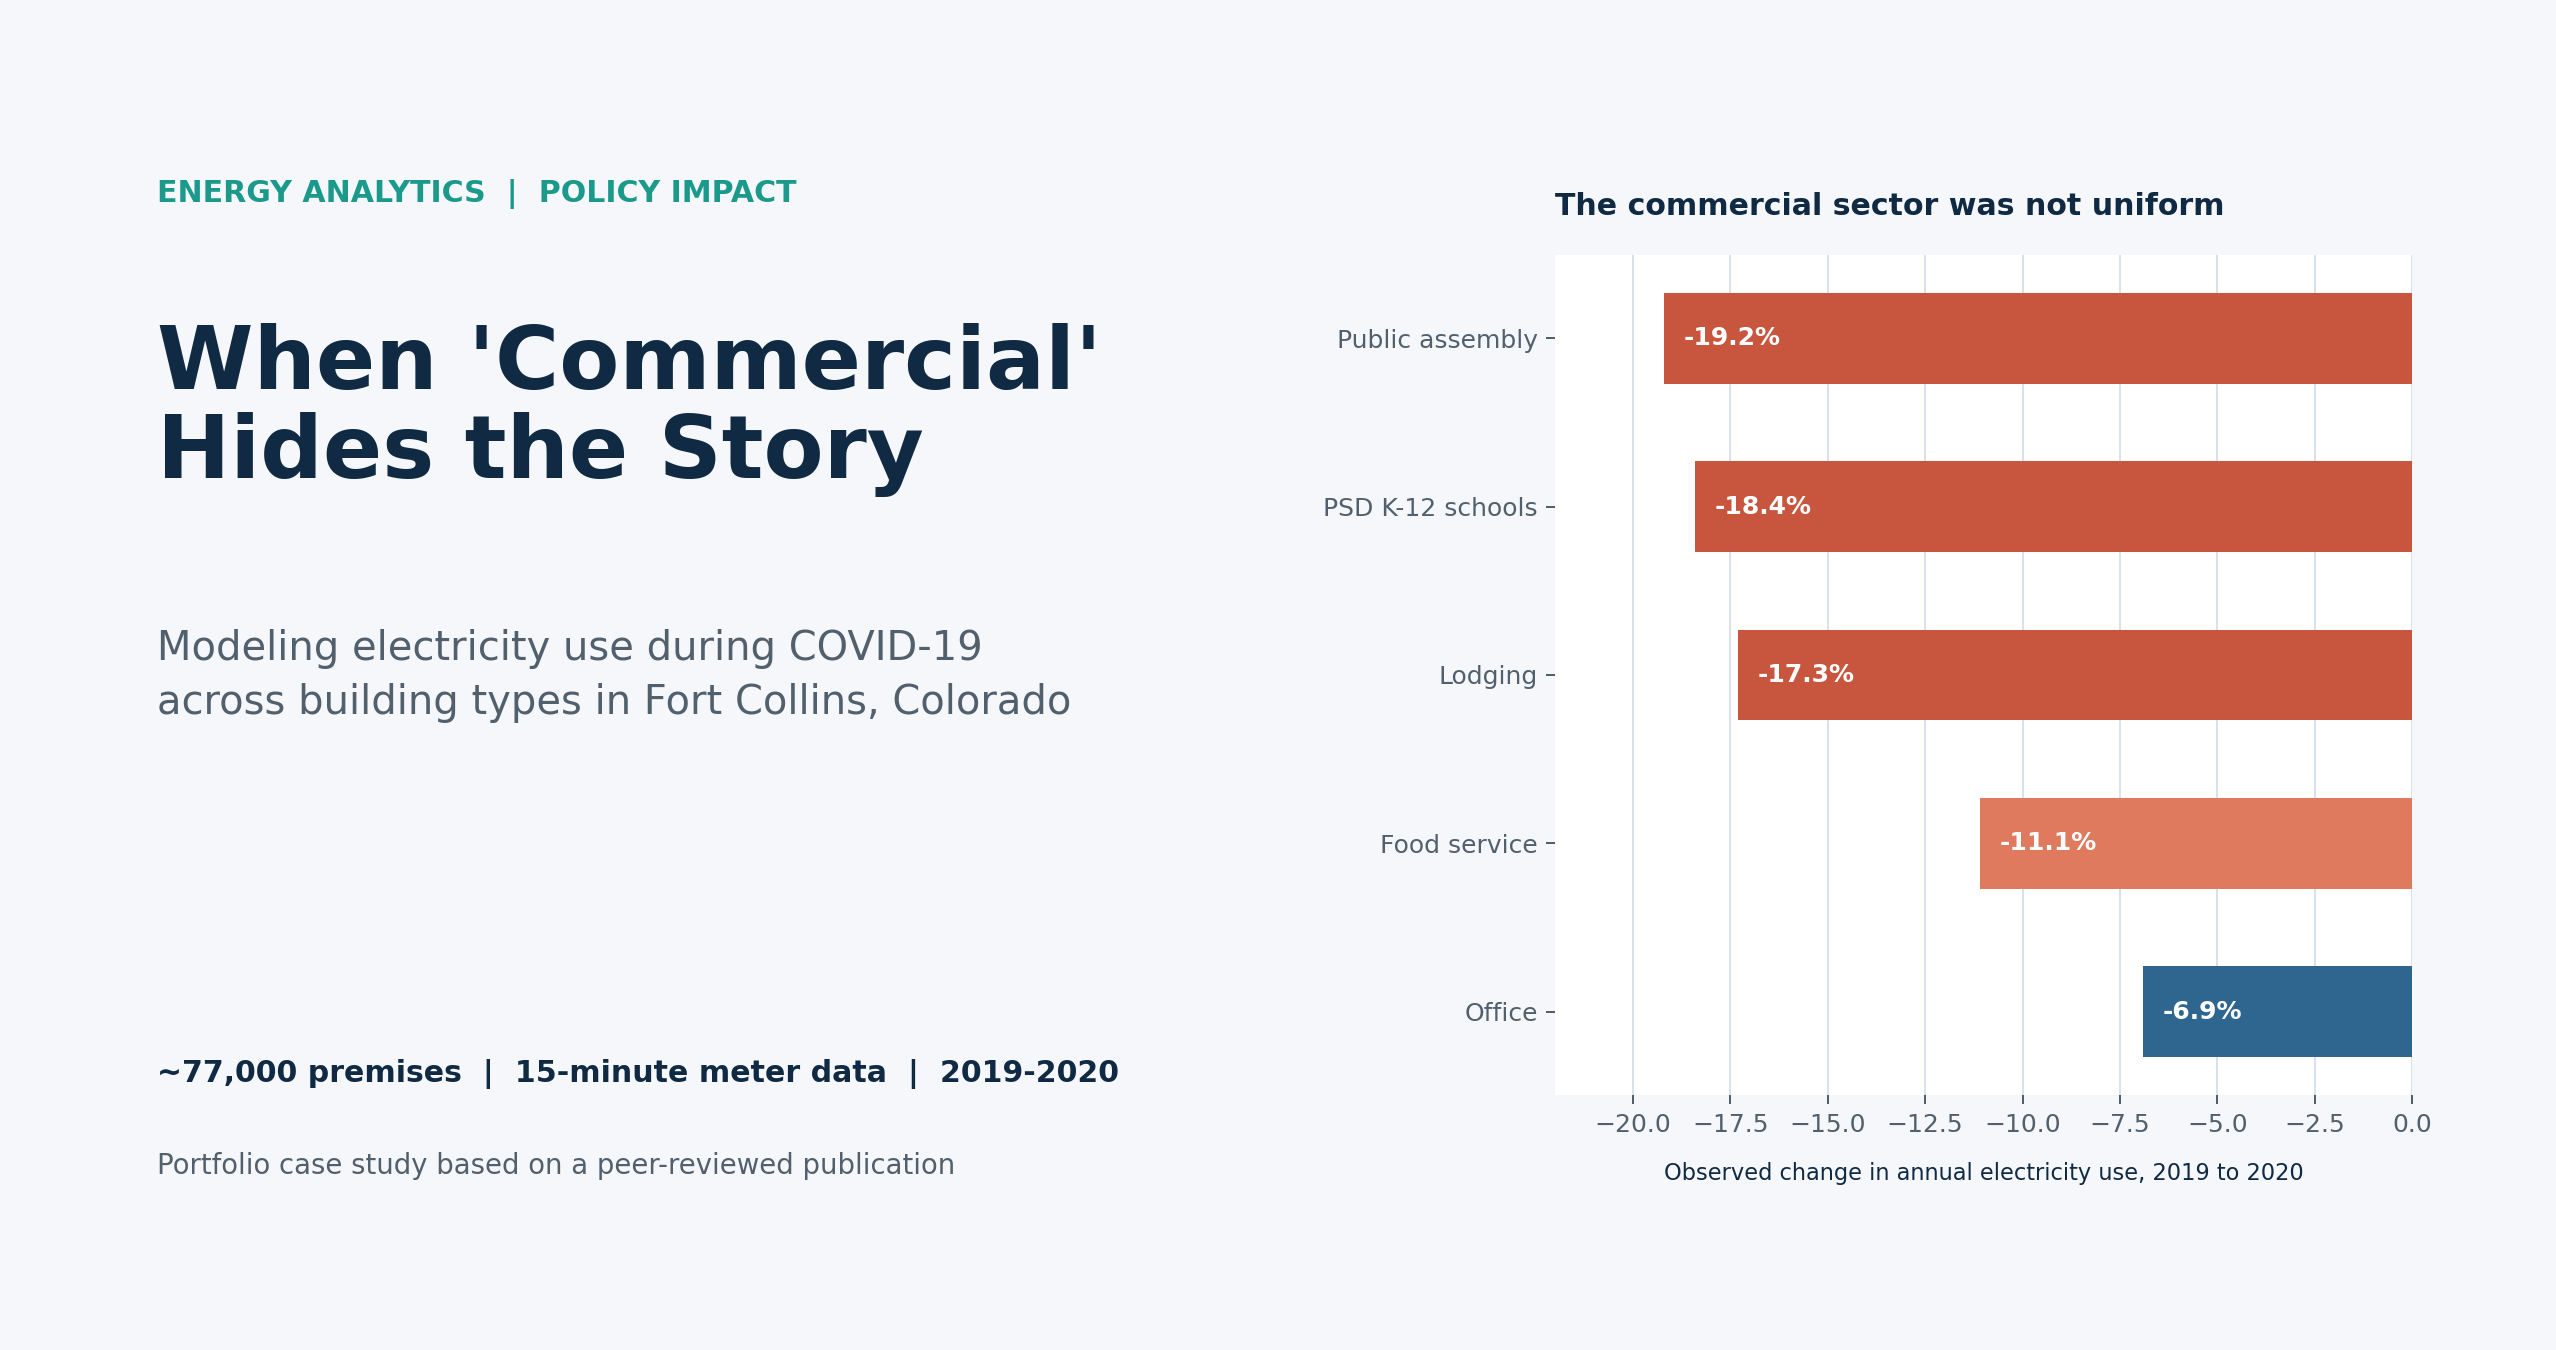
The hospitality category illustrates why granularity matters. Lodging electricity consumption declined 17.3% from 2019 to 2020, while food service declined 11.1%. Restaurants could continue some operations through take-out and food preparation; hotels were more directly tied to occupancy and travel demand.
Finding 2: weather normalization revealed timing, not just magnitude
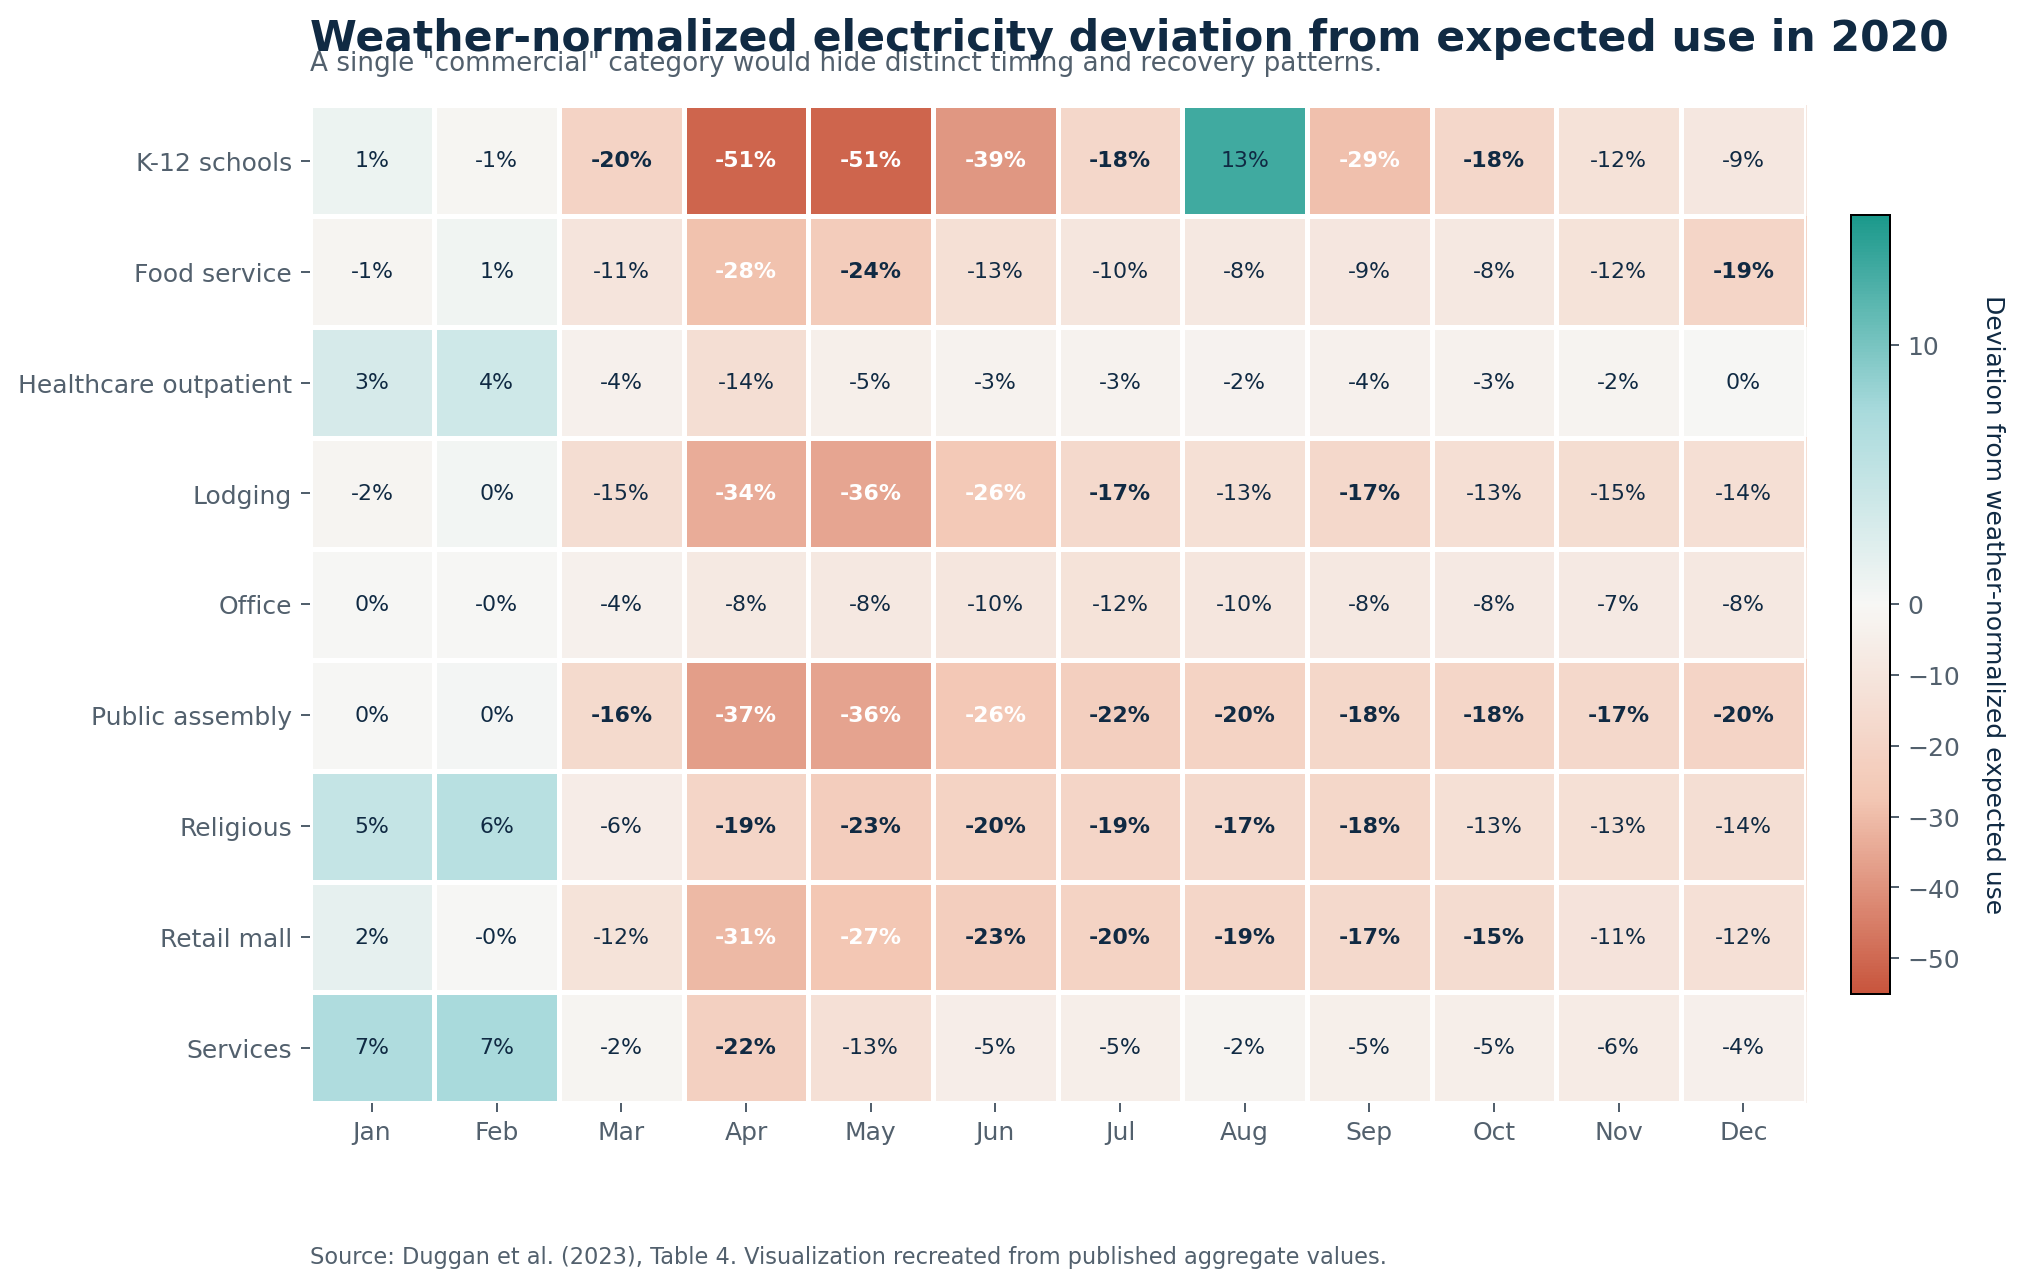
Annual totals show the scale of change. Monthly deviations from expected consumption show how changes unfolded in relation to operations and policy.
Several patterns stand out:
- K-12 schools showed particularly large reductions during months of remote instruction, including deviations of approximately -51% in April and May.
- Public assembly and religious buildings remained well below expected use for much of the year, consistent with restrictions on gatherings and continued caution after initial orders eased.
- Offices moved below expected consumption and stayed comparatively stable, suggesting sustained remote work rather than a quick rebound to pre-pandemic occupancy.
- Outpatient healthcare declined sharply during the suspension of elective and non-essential procedures, then returned much closer to expected use once that order ended.
Finding 3: recovery depended on operating model and flexibility
Three sectors make the comparison clear: lodging, food service, and outpatient healthcare. All experienced early disruption, but their recovery patterns differed markedly.
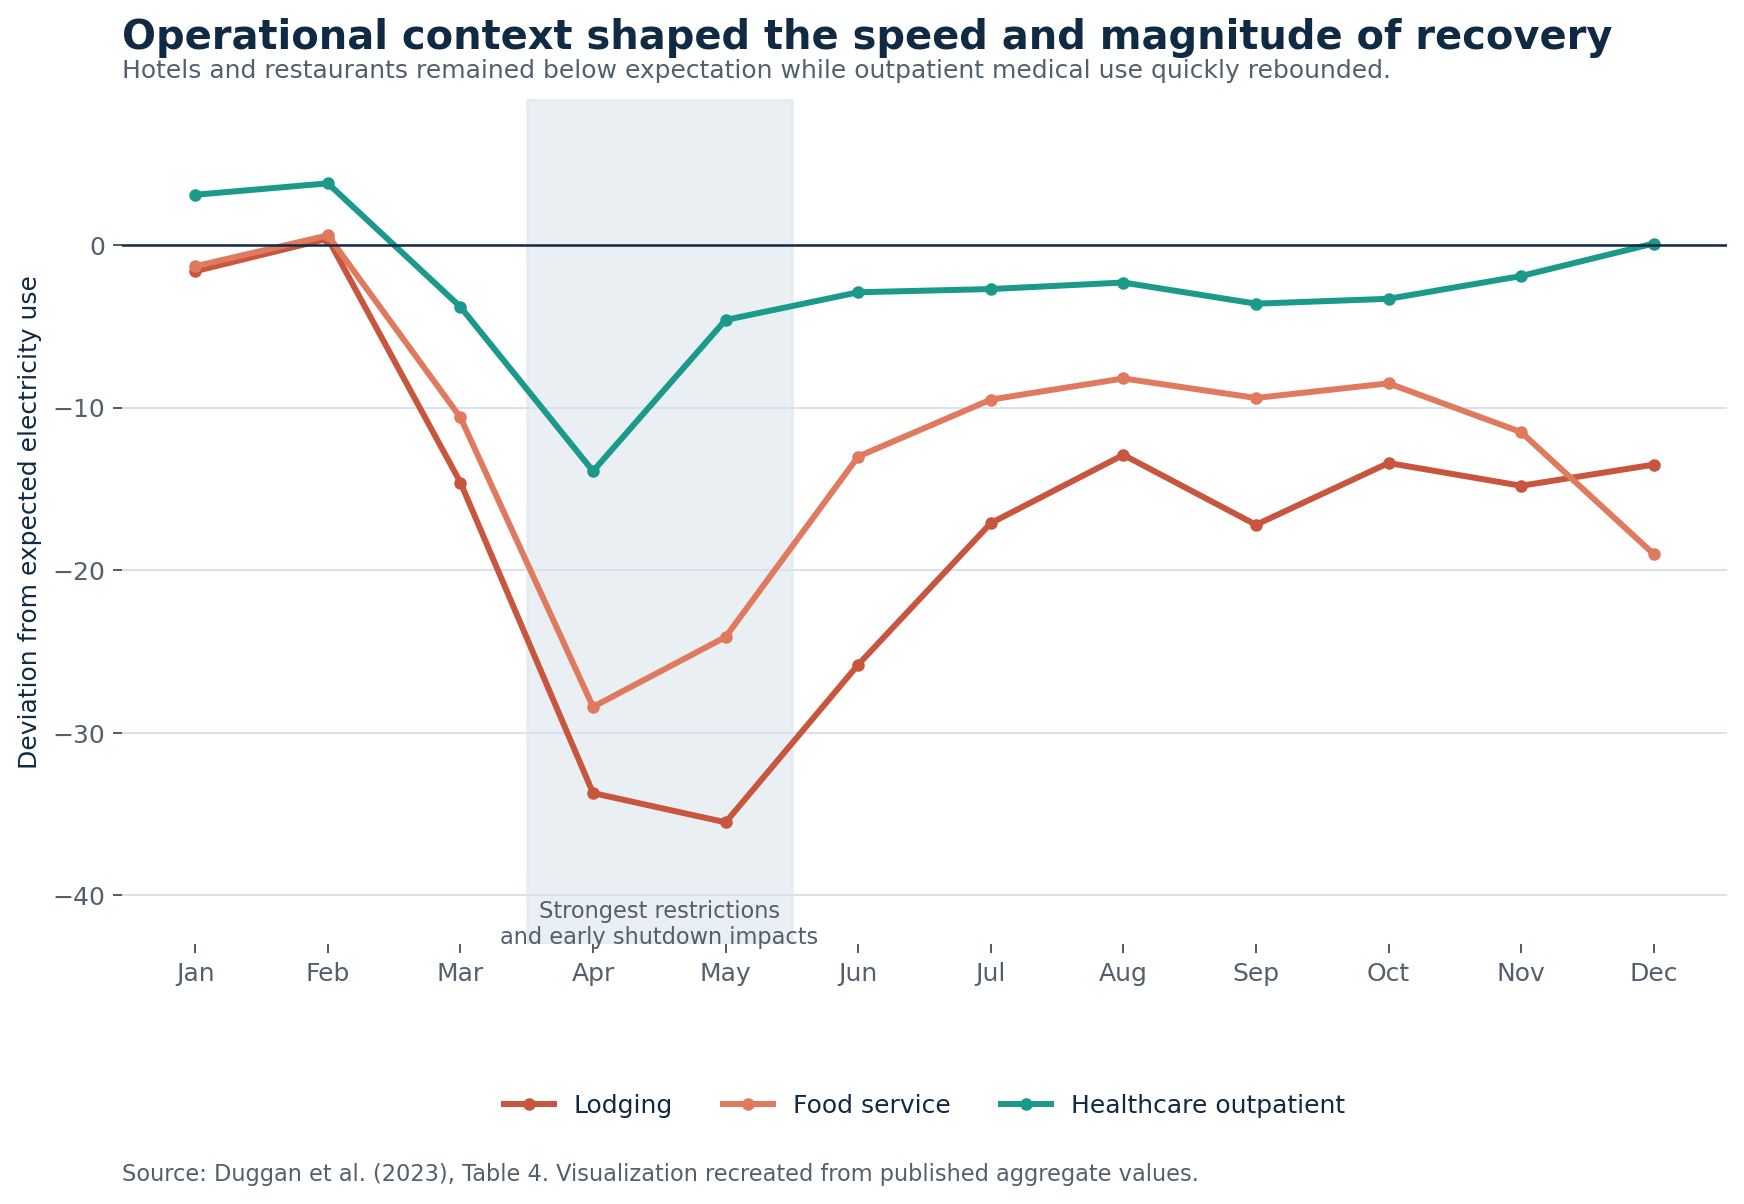
Outpatient healthcare recovered quickly after procedural restrictions were lifted. Food service remained below expected demand but was able to partially recover through adapted operations. Lodging saw deeper and more sustained reductions, consistent with dependence on travel and occupancy.
This is more than a historical observation. It points to an important analytical principle: energy demand is shaped by business function, operational choices, and behavioral response, not simply by building size or utility rate code.
Practical implications
This project demonstrates how more granular energy analytics can support real decisions.
Utility forecasting and financial planning
A system-wide decline can have serious revenue consequences, but the drivers may be concentrated in particular customer groups. Building-type segmentation can help utilities anticipate demand and revenue risk during emergencies, economic disruptions, or major changes in work patterns.
Demand response and load flexibility
Businesses differ in their ability to shift or reduce electricity use. A restaurant, office, school, hotel, and medical clinic are unlikely to respond in the same way to a demand-response incentive. Programs designed around building function may perform better than programs based only on broad commercial rate classes.
Policy and resilience evaluation
The study also shows how operational data can help interpret the effects of public policies. Electricity use cannot tell the entire story of business activity or human behavior, but it provides a high-frequency, objective signal of how different sectors responded over time.
Limitations and responsible interpretation
This work has several important limitations:
- It analyzed electricity use only; natural gas use, which is important for space heating in Fort Collins, was not available.
- Fort Collins is a mid-sized university city, and the departure of many students during spring 2020 likely affected residential patterns.
- The precise percentage changes should not be assumed to transfer directly to another community with a different economy, climate, or policy context.
- Utility consumption data were not collected for research purposes and cannot be publicly released at the customer level.
The more general finding is transferable: commercial buildings should not automatically be treated as a homogeneous analytical class when operational context matters.
Skills demonstrated in this project
- Large-scale interval meter data analysis
- Data integration across utility, property, weather, and policy sources
- Feature engineering for building operations and weather response
- Counterfactual baseline modeling and weather normalization
- Sector-level segmentation and comparative analysis
- Translating technical results into operational and policy insight
- Peer-reviewed research collaboration and publication
Publication
Duggan, G. P., Bauleo, P., Authier, M., Aloise-Young, P. A., Care, J., & Zimmerle, D. (2023). Electricity consumption in commercial buildings during Covid-19. Buildings and Cities, 4(1), 851-866. https://doi.org/10.5334/bc.361
Figures in this post were recreated from aggregate results reported in the published article. The original article is distributed under a Creative Commons Attribution 4.0 International License.